
Ask someone about their email marketing results, and they’re likely to mention their open rate (the percentage of their email recipients that actually opened the email).
But open rate is just one small part of email reporting, and it doesn’t tell the full story of the impact of your email marketing.
When you’re looking at your email reporting, it’s best to focus on the things that map directly to your business goals.
Are you trying to sell more items from your online store? Increase online donations to your organization? Get more people to register for your event?
There are email marketing KPIs that can tell you how successful your emails are at helping you reach those goals, and those are the metrics you should focus on.
Read on for how to measure your email marketing success to determine if your emails are driving real results for your business or nonprofit.
- Why open rate isn’t an effective measure of your email marketing success
- How to get to those impressive email marketing results you’ve heard about
- First ask yourself: What are your goals with email marketing?
- Email marketing metrics to measure real success
- Examples of how real small businesses use their email marketing metrics
- What do you want to accomplish for your business with email marketing?
Why open rate isn’t an effective measure of your email marketing success
Open rate is a measure of the percentage of people you send your email to who actually open it. It’s one of the first email metrics you typically see reported after sending out a campaign, and it can be tempting to watch your open rates closely in the hours after you email goes out. But in reality, an open alone doesn’t do much for your business.
Rather than simply opening your email, you want your readers to take action — purchase something, make a donation, RSVP for an event, or at least visit your website. Your open rate doesn’t tell you about any of those things. While there are some instances where open rate can be informative (more on that below), for the most part, you’ll want to focus on more meaningful email marketing metrics.
It’s also important to know that email open rates have become unreliable, regardless of which platform you use for email marketing. Apple’s Mail Privacy Protection, which became available in September of 2021, prevents email marketers from knowing if Apple users opened their emails. We anticipate that this change impacts approximately 50 percent of email subscribers, and other major tech companies could follow Apple’s lead, making open rates even more unreliable if not entirely obsolete in the future.
How to get to those impressive email marketing results you’ve heard about
You might have heard some compelling email marketing statistics that first compelled you to start email marketing in the first place. Things like:
- Email marketing has an average return of $36 for every $1 spent (Litmus).
- Email is roughly 5x as likely to drive someone to make a purchase than social media (OptinMonster).
- 60 percent of consumers have made a purchase as a result of an email marketing message (OptinMonster).
- 61 percent of consumers actually want to receive promotional emails weekly (MarketingSherpa).
As good as these email marketing stats look, you may struggle to understand how email marketing impacts your business. You want to make sure that you’re tracking towards that 42:1 return on your investment. So let’s take a look at how to measure and maximize the success of your email marketing.
First ask yourself: What are your goals with email marketing?
The email marketing KPIs you’re looking for depend on what you’re trying to accomplish.
Maybe you’re trying to increase your sales, get traffic to your website, or get people to attend an event. Whatever the case may be, there’s usually a metric in your email reporting you can use to see the real results of your email marketing efforts.
When you have a focused goal for your email campaigns, you can use these metrics to refine your emails, learn what works for your subscribers, and optimize your email marketing strategy for success.
Let’s take a look at how to use email reporting to measure your email marketing success based on some specific business goals.
Email marketing metrics to measure real success
While these scenarios don’t represent every single email metric, I hope they’ll give you an idea of how to approach measuring your success — starting with a clear goal for every email campaign.
For website traffic: Clicks and click rate
Your goal with email marketing is to drive some sort of meaningful action. Most of the time, that action can’t take place within the email itself. Whether you want your subscribers to make a purchase, learn more about your business, contact you, or just read an article on your blog, it all starts with a click that takes them to your website.
In email reporting, we measure website traffic in terms of clicks.
- Clicks simply refers to the number of clicks from an email. These clicks can be to any link within the email, including to your social media pages, but most of the time, we recommend directing people to your website.
- Click rate is the percentage of email recipients that click through to your website.
It’s important to look at both clicks and click rate to get a full picture of the success of an email marketing campaign. For example, 5 clicks might seem disappointing, but if that particular email campaign was only sent to 20 people, that would mean your click rate is 25%, which is great! That means that one in four recipients of your email clicked through to your website, which is one step closer to a meaningful action for your business.
But getting people to your website is just one step in the right direction. There are more metrics in your email reporting that can get you closer to understanding the real value of your emails.
For increased sales: Conversion rate, total orders, and total sales
When assessing how effective your emails are at driving sales, you’ll typically want to focus on your conversion rate. Email marketing platforms that are built with ecommerce in mind, like Constant Contact, will also include metrics directly related to ecommerce, like total orders and sales.
- Conversion rate is the percentage of your email recipients that take a specific action. It could be RSVPing to an event or filling out a survey, but in this case, it means completing a purchase on your website.
- Total orders is exactly what it sounds like — the number of orders generated by your emails.
- Total sales represents the actual revenue driven by your email campaigns. Rather than just how many orders you generate, this number factors in the price of the items you sold. So if you sold 10 items at $10 each, your total sales reported would be $100.
Here’s what ecommerce reporting looks like in Constant Contact:
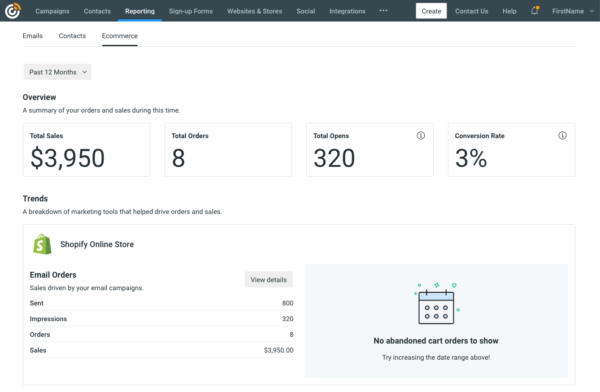
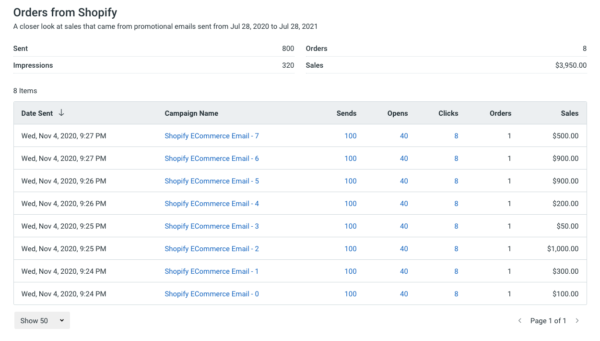
You can view ecommerce reporting for your email marketing efforts as a whole over a specific period of time, as in the example above, or you can see orders and sales for specific email campaigns, as shown below.
Using conversion rate helps you understand how effectively you’re driving sales. If you’re not getting the results you were hoping for, you can look at other metrics to gain more insight into the problem. For example, if your emails are generating a large number of clicks, but not many sales, your problem might be with your website or online store.
Perhaps your email piqued your subscribers’ interest in a product, but after clicking through to your website, they weren’t convinced by your product description. Or maybe they started the checkout process and abandoned their shopping cart. If you’re seeing clicks, but not sales, it’s probably worth revising your product description or setting up an automatic abandoned cart email to remind shoppers to complete the checkout process.
For event attendance: RSVPs
When it comes to using email to drive interest in an event, whether in-person or online, you could look at clicks to your event landing page or conversions (which in this case would refer to completing a form). But the best path to measuring success is often more direct. That’s why Constant Contact includes built-in event RSVP functionality and reporting.
RSVPs will show you the total number of responses you received, plus a breakdown of how people responded (Yes, No, or Maybe)
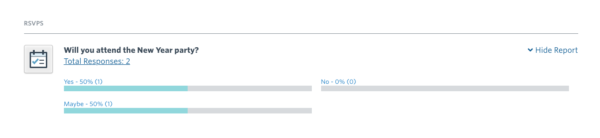
Having RSVPs built-in makes it easier for you to know how well your email campaigns drove interest in your event. You’ll also be able to then see who responded in which way so you can follow up accordingly.
- For people that RSVP’d “Yes,” send them a series of event reminder emails so they remember to attend.
- For those who said “Maybe,” consider following up as the event date gets closer, asking them to update their RSVP and encouraging them to attend.
- Even those who said “No” took the time to do so, and can be re-engaged thoughtfully. After the event, kindly send a recap with images showing what they missed, enticing them to attend the next time. Or if your event was virtual and you have a recording, share the recording with them since they couldn’t attend live.
Just like with other email goals, you can learn more about your success in driving event interest by looking at other metrics. For example, if you’re seeing a high number of clicks, but a low number of RSVPs, you might want to re-examine your RSVP form to see if it describes your event in an appealing way, and if it’s clear and easy for people to use. If you’re not seeing any clicks from your email, you might need to re-work how you describe the event within the email and see how you can make it more attractive to your subscribers.
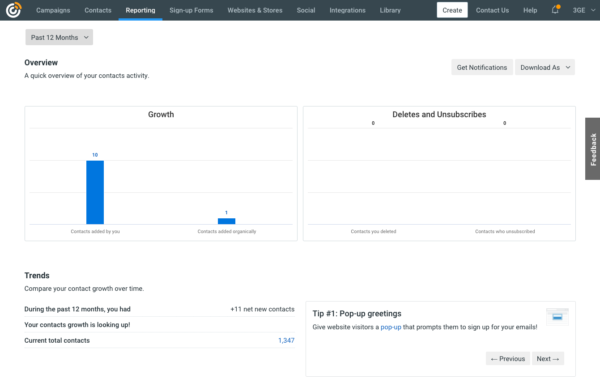
For growing your customer base: Subscriber growth
One of the best ways to make your email marketing more effective is by emailing more people. After all, having more people to send to means more chances that one of your email recipients will click something in your email and take a valuable action on your website.
Subscriber growth shows the total number of email subscribers you’ve added, alongside those you’ve deleted or who have unsubscribed.
Looking to increase your subscriber growth? Check out our tips for how to grow your email list.
Other email marketing KPIs to pay attention to
Throughout this article, I’ve talked about looking at all of your email marketing metrics to get a full picture of the success of your campaigns. Depending on your goals, some metrics are going to be more important than others, but it’s important to know what all of your email reporting terms mean if you want to gain a full understanding of your campaigns.
While the metrics below don’t necessarily map directly to your goals, they still can indicate pain points or technical issues you might want to address to maximize the impact of your email marketing.
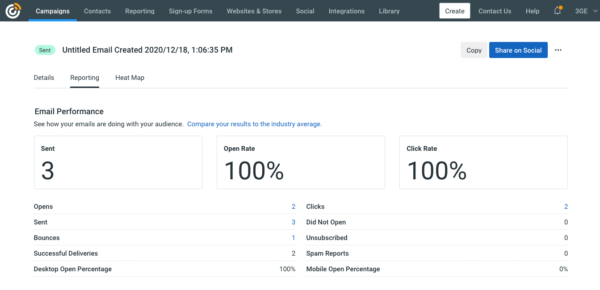
- Bounces are the number of your email subscribers who did not receive your email. Bounces occur for a few reasons, like an error in an email address, a filter preventing your email from being delivered, or a full mailbox.
- Successful Deliveries is simply the number of subscribers who did receive your email successfully.
- Unsubscribes are those contacts have asked to no longer receive email from you. It could be that they didn’t like your email, or maybe your emails are just no longer relevant to them.
- Spam reports are the number of subscribers who marked your email as spam or junk. It’s important to pay attention to these, and consider cleaning up that subscriber from your email list.
- Open rate is the percentage of email recipients that actually open your email. As we went over earlier, open rate isn’t very reliable, but most email marketing providers still make open rate data available. You can still compare open rates across your campaigns to get a general idea of the effectiveness of your email subject lines, but it’s important to always take open rate data with a grain of salt, and not to rely too heavily on it when measuring your success.
Examples of how real small businesses use their email marketing metrics
Now that you have an idea of the email reporting metrics available to you and what they mean, let’s look at a few real-world examples of how these metrics can be used to assess the effectiveness of your email marketing.
1. Turnstyle Cycle: Standing out from the competition and reaching more people
Matt Juszczak, of Turnstyle Cycle, uses email marketing to grow, engage, and retain his customer base. Growing an email list and sending unique emails to his customers helps him stand out in an increasingly competitive market.
Here’s an example of a special snow-day-themed email Matt recently sent. By including a deadline and offering a mystery discount, Matt piqued interest and spurred his readers into action.
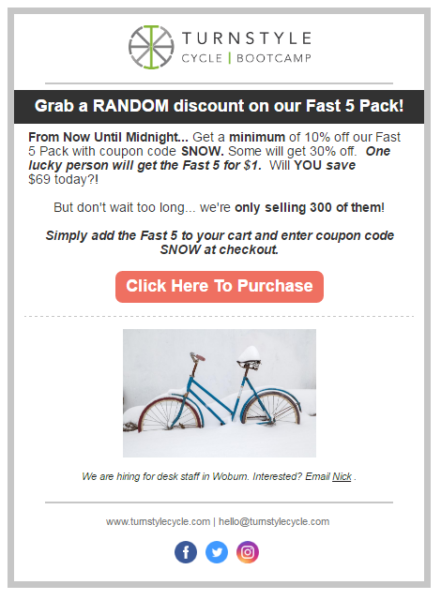
“With our Constant Contact marketing, we try to be fun with it,” Matt explains. “In this recent promotion, I changed the discount amount every few minutes, just as a customer delighter,” he says. “We made $20,000 in sales in one night.”
What to track
Increase the impact of your email marketing by paying attention to your subscriber growth. Use your list growth report to see where the most signups are coming from. Make sure you’re doing everything you can to build your email list at every touchpoint.
2. Autumn Boles: Driving traffic to a website
Autumn Boles, of Robert Paul Properties, uses email marketing to drive website traffic and convert prospects into happy homebuyers.
Here’s how she promotes new property listings to her subscribers:

“We want to get people to our website, deliver a quality experience, and ultimately convert them to clients that buy or sell a house with us,” says Autumn. “We know a significant percentage of our website traffic comes from our emails.”
What to track?
Use clicks and click rate to see how many subscribers are visiting your website from your emails. For a deeper look, you can use Google Analytics on your website to track spikes in website traffic and then see what visitors actually do when they arrive at your website.
Learn more about how you can drive website traffic with email.
3. Southern Underdeck Systems: Increasing sales
Heath Bowman, the owner of Southern Underdeck Systems, sent an email offer to his contact list on Cyber Monday.
It wasn’t something he’d ever done before, and he wasn’t expecting much from it. In the end, he booked 27 jobs resulting in $67,000 in sales.

“After I sent our email my phone didn’t stop for the next 10 hours! I was literally taking calls at midnight,” says Heath.
What to track
Pay attention to your conversion rate, total orders, and total sales after you send an email. For an even more in-depth view of how email marketing increases sales, consider integrating Constant Contact with your point-of-sale system.
What do you want to accomplish for your business with email marketing?
No matter your business goal, it’s likely these email marketing KPIs can help in some way. Learn how others have found success by checking out the top benefits of email marketing as told by small business owners.
And before you send your next email, ask yourself, what action do I want the reader to take? And how will I track the results?
Yes, you’ll want to interpret your email reports, just don’t forget to incorporate all of your email marketing metrics to get the best picture of your results, and learn how you can improve.


