If you’re looking to find the best time to post on Facebook, the first place to start is Facebook Insights.
Facebook Insights is a valuable tool to help you improve your Facebook marketing. And Facebook’s made them even better with some recent updates.
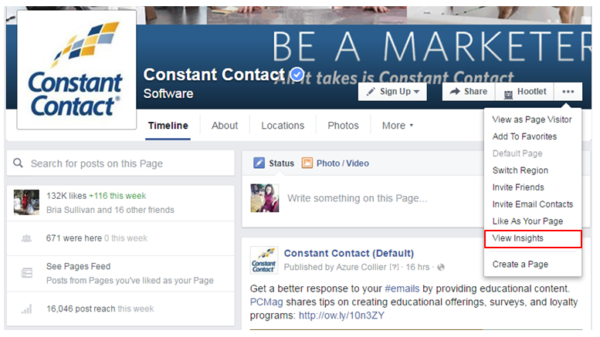
You can find Facebook Insights for your own business page by navigating to the dropdown in the top right of your Facebook Page.
In this post, I’ll discuss key metrics you should look for in Facebook Insights and the updates you should know about as a marketer.
1. View when your fans are online
Within the Posts tab, you’ll discover two graphs that illustrate the average number of fans who saw any posts on Facebook by day of the week and the average number of fans who saw any posts in an hour. It’s important to note that these metrics do not indicate how many fans actually see your content, but rather how many people are on Facebook at a given time.
It’s important to note that these metrics do not indicate how many fans actually see your content, but rather how many people are on Facebook at a given time.
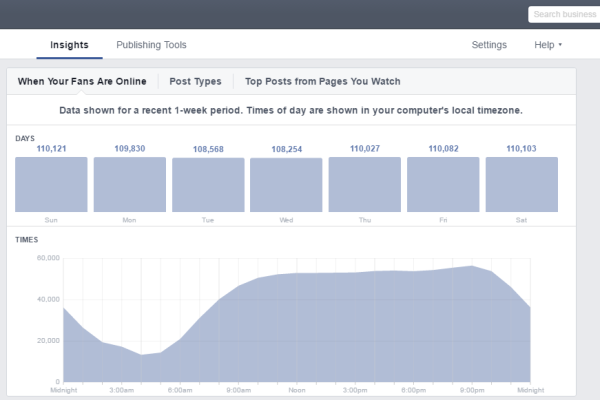
This tab can help answer the one question so many page managers speculate about: when is the best time to post on Facebook?
But these two graphs are not the definitive solution to discovering the optimal posting time just yet. Yes, aiming to schedule your Facebook Page’s content when the majority of your fans are online is important for increasing engagement, but the peak fan rate may not be the optimal time.
You should try to find your engagement sweet spot by determining the intersection of time when the majority of your audience is on Facebook and the time when the least overall posting is occurring.
2. View reach and engagement of posts
After you’ve started to look at the best time to post, Facebook Insights’ other sections will help you determine the best content to post.
Start with the “All Posts Published” analytics in the Posts tab. This section shows your posts in reverse chronological order and enables you to get a good look at your posts’ reach and engagement.
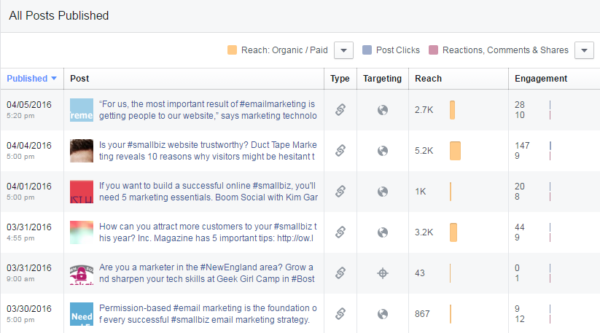
You can filter reach by:
- Reach (overall)
- Reach: Organic/Paid
- Impressions: Organic/Paid
- Reach: Fans/Non-Fans
- Post Clicks/Reactions, Comments & Shares
- Reactions/Comments/Shares
- Post Hides, Hides of All Posts, Reports of Spam, Unlikes of Page
- Engagement Rate
The Engagement Rate helps you to understand the success of your individual posts. Facebook calculates the official Engagement Rate as the percentage of people who saw a post that reacted to, shared, clicked, or commented on it.
The outcome illustrates the portion of your audience that is engaged with your content, consequently indicating the quality and success of your posts.
If one post is reaching a significant amount of people, but not producing much engagement, the News Feed Algorithm marks the post as low quality. Too many low-quality posts hurt your chances of appearing in your fans News Feed in the future. By regularly reviewing the metrics related to the posts you publish, you can begin to understand what content your audience is most responsive to and work toward creating quality, engaging content.
By regularly reviewing the metrics related to the posts you publish, you can begin to understand what content your audience is most responsive to and work toward creating quality, engaging content.
One recently-introduced feature to note is the addition of Facebook Reactions in the Insights engagement metrics.
Tracking Reactions to your posts enables you to get more information on sentiment, or what your followers think about the posts you’re sharing. If you see a post with Reactions activity, click on the post in the “All Posts Published” list to open up a window that calculates how many people used the six different reactions.
3. Find your best post type
This section within the Posts tab, called “Post Types,” displays the type of content that produces the highest reach and average engagement for your page.
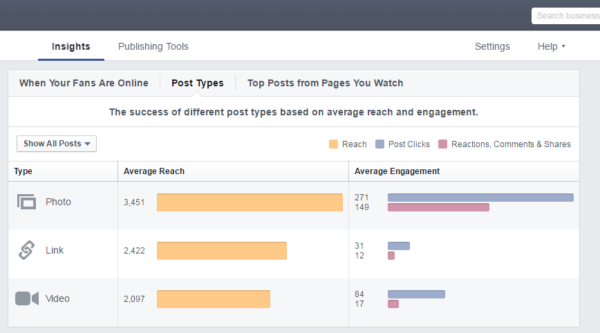
The type of post you publish matters when it comes to creating better Facebook content. Depending on your social media marketing goals, use this data to understand which type of post will help you succeed.
Facebook is placing a larger emphasis on video content with the introduction of its Facebook Live livestreaming feature, so it’s important to keep an eye on how your video content is performing versus other types in order to discover what your audience engages with the most.
Tip: Brand new to Facebook Live? Read the 10 Lessons We Learned From Our First Facebook Live.
4. Videos tab
You can dig deeper into your video metrics with Facebook’s most recent video Insights updates that rolled out in early 2016. The Videos tab shows you the number of video views, number of views for 10-seconds or more, and a list of top videos.
These metrics can be filtered by Organic vs. Paid, Auto-Played vs. Clicked-to-Play, and Unique vs. Repeat.
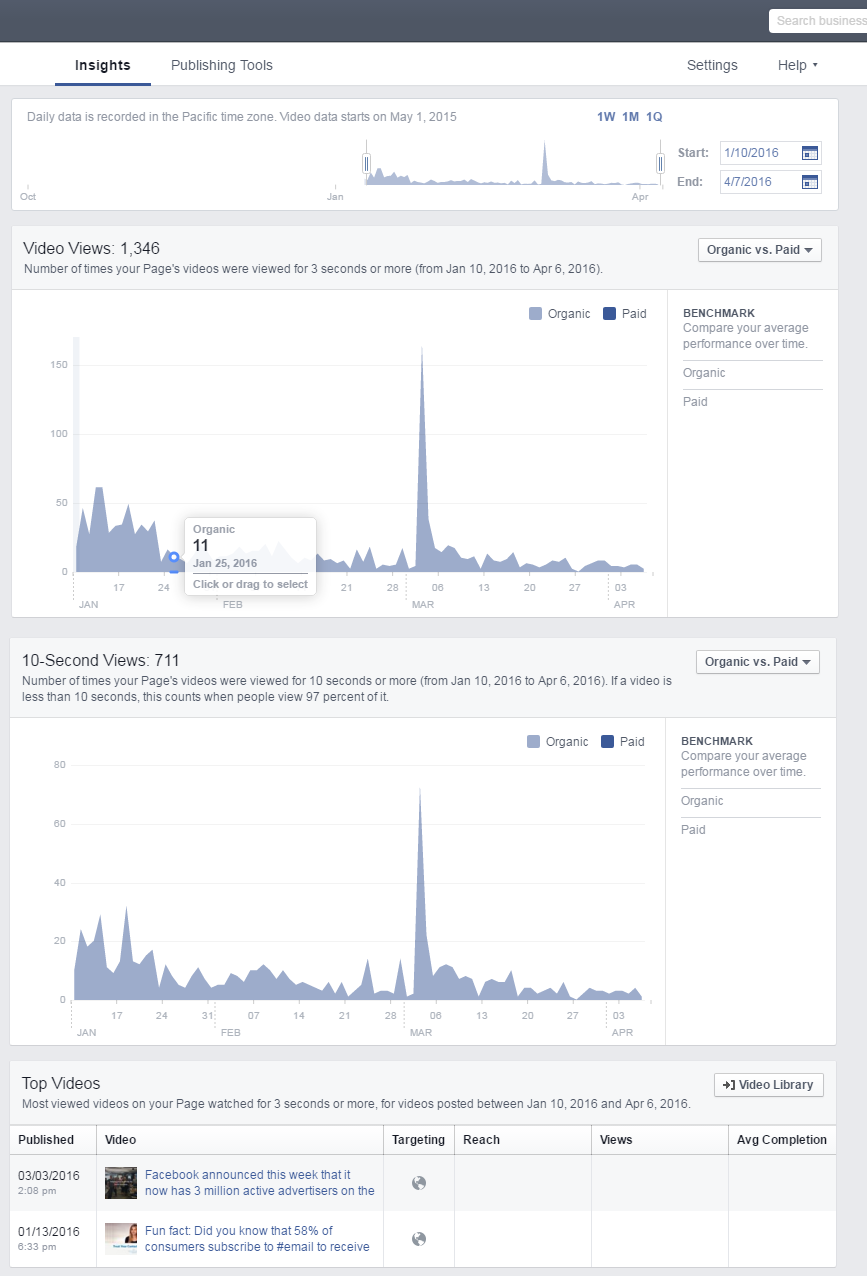
Click on one of the top videos — or access other videos by clicking the Video Library button — and you’ll see a daily breakdown for a specific video of how many minutes it was viewed, the number of unique viewers, total video views, 10-second views, and the average percent of viewing completion. Clicking on any of those stats will open up a graph with additional information.
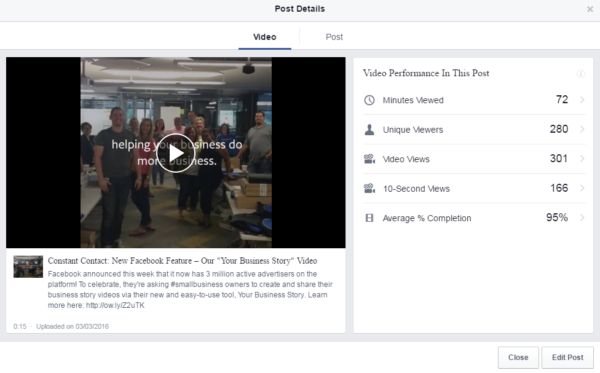
The daily breakdown will give you more details on the performance of your videos that you can use to improve your video content strategy.
5. Facebook Live analytics
Facebook recently rolled out its live streaming video feature to Facebook pages, along with a new set of metrics.
When you click on the video of one of your Facebook Live posts through Facebook Insights or your Video Library, you’ll see information on the size of your live broadcast audience, the number of total minutes viewed, unique viewers, views, 10-second views, and the average percent of viewing completion.
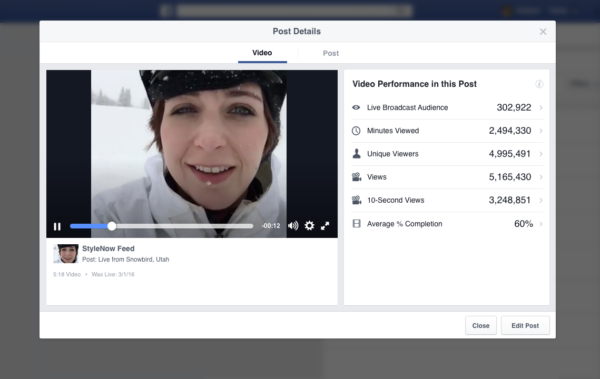
Use these metrics to find out what live videos your fans are interested in and create more live streaming videos to share with your audience.
6. Know your audience demographics
Under the People tab, navigate to “People Engaged” to find three sets of demographics, including an overview of your fans, the fans you’ve reached, and engaged fans.
These analytics allow you to view who engages with your content by gender, age, location, and language. The interactive graphs within all these sets of demographics allow you to hover over the segments to display more information.
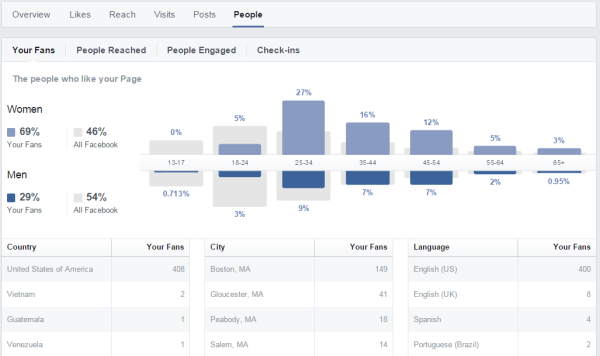
It’s important to review the demographics of your page to get a better understanding of who your audience is to improve your Facebook marketing strategy. You do not need to monitor these insights as frequently as the success metrics for your content, but it is important to be aware of these insights.
7. Actions on Page tab
Facebook Pages can activate a Call-to-Action button that encourages visitors to complete one of 11 different actions, including signing up for their emails, booking appointments, calling the business, or purchasing a product.
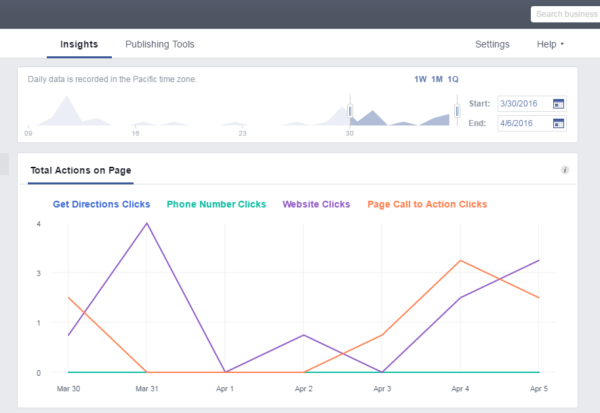
In the Actions on Page tab, you can find out how many people clicked on your Call-to-Action button, the demographics of people who took that action, and whether they used a smartphone or computer when they clicked the button. Try switching your call to action, and then check your Insights to find out what types of actions people are interested in.
Use Facebook Insights to be a smarter Facebook marketer
Take advantage of Facebook Insights and its recent upgrades to find the best time to post on Facebook, better understand your audience, and create the best Facebook content for them.
Want to learn more?
For more Facebook resources, visit our Facebook 101 Page.


